Categories
Month: August 2016
Categories
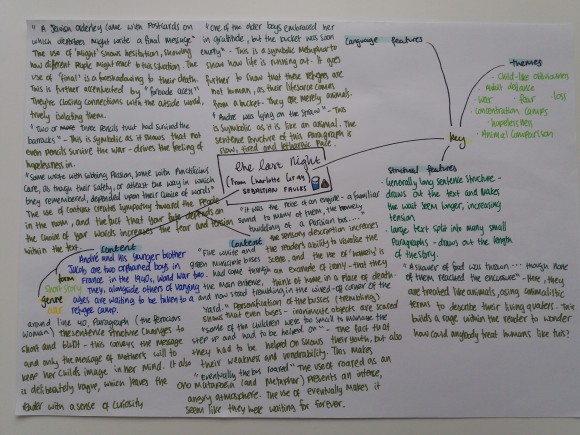
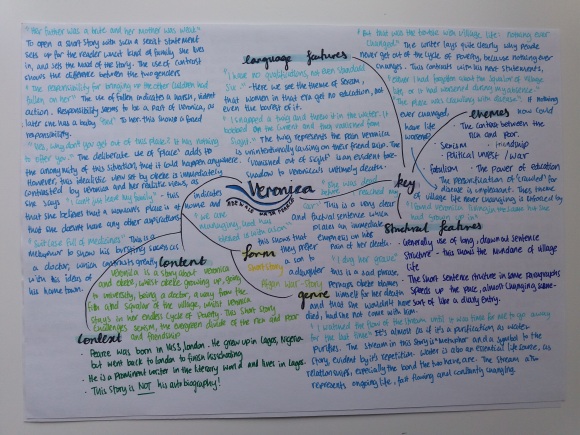
The Last Night (From Charlotte Gray)
Categories
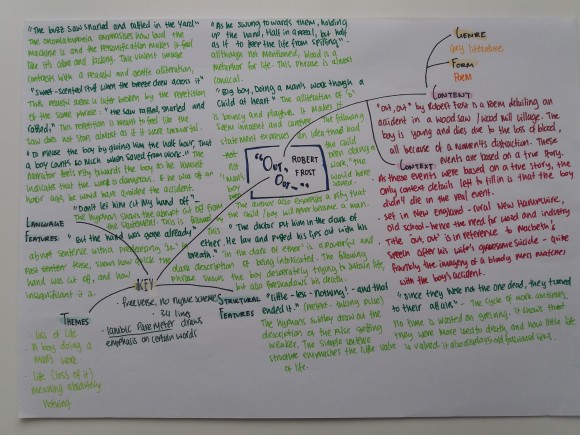
“Out, Out – “
Categories
Geography Topic 6: Population Change
3.1 population growth and distribution
a. the growth and distribution of global population
Population distribution – the pattern of where people live.
- World population distribution is uneven –
- Dense, crowded areas (Coasts of China)
- Sparse, empty areas (Interior of Australia)
Population density = number of people who live in an area / area (km2)
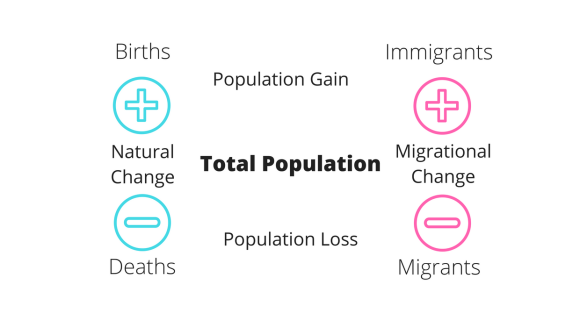
2 things that cause population growth:
- Birth rate
- Death rate
Population = Births – Deaths
- Positive population growth: more births than deaths (also known as natural increase)
- Negative population growth: Less births than deaths (also known as natural decrease) This is a sign of a developed country, as the cost of raising a child increases severely
Factors that affect population (with examples)
Densely populated areas:
- North USA – Good job opportunities
- North Europe – positive culture and tradition, highly developed super power nations, perfect temperatures for farming
- Japan – stable government, coastline makes it easily accessible for trade
- Ganges – good water supply, flatland and fertile soils
- India – lack of education and lack of empowerment of women
- Syria – becoming less dense – (OUTWARD MIGRATION) – due to war and conflict (2016, 4.6 mil evacuees)
Sparsely Populated areas:
- Alaska and Greenland – sparse – hostile climate, difficult for agriculture
- Himalayas – difficult to access, thin infertile soils, poor nation and restricting cultures and traditions
- Amazon rainforest – limited jobs, high humidity
- Central Africa – hostile climate, unstable government
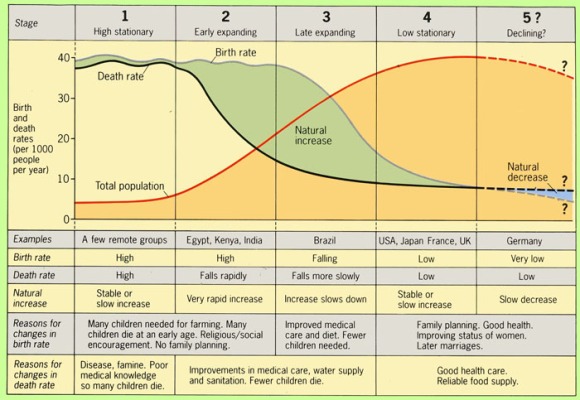
b. reasons for changes to birth and death rates, including the study of the demographic transition model
- Overall rate of population change depends on natural and migrational change
- Positive: Natural change + migrational change = rates of population growth is high
- Negative: Natural change + migrational change = High rate of population loss
- If these changes are balanced, there is little to no change.
Demographic Transition Mode: Measures the rate of natural change, these changes underline a generalisation of development
c. the physical and human factors affecting the distribution and density of population in China and the UK
Case Study: CHINA
- The population of china is concentrated on the eastern half of the country, 1,000 people /km ^2.
- Sparse population belt to the West, 5 people per km^2
- North West – another high population belt, around 25-250 people/ km^2
Links with relief (physical geography)
- Eastern belt of dense population coincides with low lying, flat coastal areas with rich and fertile soils
- Explains the northern belt of sparse population with high (over 5,000m) mountain ranges and desert atmosphere
Links with rainfall (physical geography)
- East has >50cm/year worth of rainfall (water in abundance)
- Elsewhere <5cm/year worth of rainfall, often as snow
Links with economy/history (human geography)
- Concentrated belt of population around the coast due to the country’s major trading ports – it’s centre of industry attracts people globally
- Therefore coastal towns tend to be more modern due to the increasing economy, therefore more desirable than rural chinese countrysides
CASE STUDY: The UK
Links with relief and rainfall
- Highlands and islands of Scotland, Northern Ireland, Wales and England are sparsely populated because of low rainfall and high relief
- South East and North West as well as central Scotland densely populated, >600 people / km2!
Links with economy
- Highest population coincides with coal fields due to the industrial revolution attracting huge amounts of industry
- London is an urban and very wealthy city that attracts people because of jobs, education and leisure.
d. how two countries cope with contrasting population problems, one trying to increase and the other trying to decrease the birth rate
CASE STUDY: CHINA’S ONE CHILD POLICY (1CP)
Stats:
- Start date: late 1980
- End date: Early 2016
- End product: 120 boys : 100 girls
- China has the third largest economy
- Urban population of China is 43%
- Fertility rate prior to the 1CP: 2.9
- Fertility rate post the 1CP: 1.7
- Prevented a total of 400 mil births
- Current population: 1.3 bn
Purpose:
- To rein in China’s population (if not, there would be unprecedented population growth)
- Speed up it’s development by limiting the number of births (number of mouths to feed)
Exceptions (Only a couple years towards the end of reign):
- End products of 1CP (the ‘4-2-1’ problem, 4 grandparents, 2 parents, 1 child)
- Those who lived in rural areas (Needed an extra pair of hands to help on the farm, especially if that first child was a girl)
- Mentally ill/ disabled
- First child = girl
Enforcement:
- Hefty fines after each child
- Forced sterilizations
- Pressure to abort pregnancies
- Discrimination at work
Incentives:
- Cash bonuses
- Longer maternity leave
- Preference for schools, nurseries and higher education
- Access to houses and healthcare
Impacts:
- Severe gender imbalance (120 boys : 100 girls)
- An aging population
- Diminishing workforce
- Falling fertility rate – 6 births/women, 1970. 2 births/women, 1980
- Generations of only children – ‘little emperor syndrome’ – spoilt children with no ability to share, work or be independent
- The 4-2-1 problem
- Corrupt means to achieve yearly raises for ‘family planning officials’
- ‘Illegal children are seized by officials and are victims of child trafficking.
- Trauma from those victims which suffered beatings, forced sterilizations and abortions
- Historically male preference as a result: sex selective abortions, not registering female births and female infanticides
- In rural areas, there are twice as many men (often nick named bachelor villages). Wives are expensive – $8,000 dowry.
- Estimated 24mil men without wives by 2020 China
- Fines of multiple children can be 10x the yearly wages in rural areas
- Increased academic pressure on the single child – chinese schooling system is very competitive and often leads to suicide
Future:
- Hope for dependents to economically active ratio will even out
- Reminder that China as a country is still developing
CASE STUDY: SINGAPORE’S ‘HAVE THREE OR MORE!’
Stats:
- Mid 1960s (1 child policy)
- Policy reform 1960s –> onwards
- Population density – 8,000 / km^2
- Popuation now – 5.4 mil, (75% Chinese, 14% malay, 9% Indian and 2% other)
Why:
- To reduce the rate of population growth as the prime minister was worried it might be overpopulated as it is a small island
- Policy reform in 1980 July/August to grow the population as it was decreasing before
Incentives:
- Tax rebates for each child
- Cheap nurseries
- Preferential acess to the best schools and housing
- Pregnant women offered counselling to discourage abortions and sterilizations
On immigration:
- Singapore used immigration as a way to increase population – but only residents can have 3 or more, non residents have to ‘stop at 2’, this is a means to preserve the genetic make up of the country.
3.2 characteristics of population
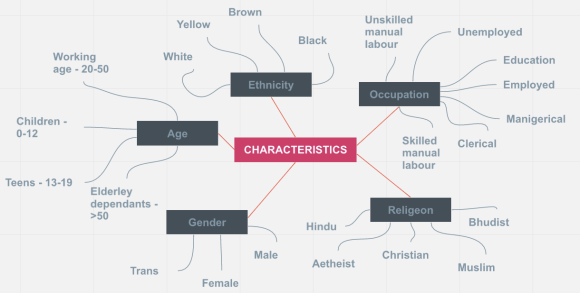
a. the characteristics of population on a local scale including age, gender, ethnicity, religious and occupational structure
Census – a census involves literally counting everyone in a country or region and recording their characteristics (age, gender, ethnic origin), usually every 10 years and is mandatory
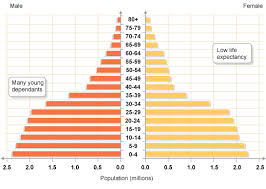
b. comparison of population pyramids for three countries at different levels of development
A population pyramid’s shape is controlled by:
- Birth rate – the higher it is, the wider the base
- Death rate – the lower it is, the taller the pyramid
- Balance the two rates, and if births exceed deaths and vice versa.
- Short top as very few people reach old age due to low life expectancy – high death rate, poor healthcare
- High birth rate – wide base
- Narrow base as birth rate falls
- MICs often categorized by falling birth rate and death rates (DTM stage 3)
- It loses its triangle shape as life expectancy rises
- Bulge in the working population
- Low death rate – higher life expectancy
- HICs have a low death rate – hence the narrow base
- Also known as a ‘greying population’ – if the peak is heavy, that means life expectancy is high, advanced medicine
c. consequences of youthful and ageing populations
Young Dependants (Under 16s)
- More people will need to be employed, housed and fed
- Public money will need to be spend on nurseries, schools and clinics
- Dependence on parents, challenge to support functioning growing families
- Political priorities of a youthful population: Education and job creation
Elderly Dependants (Over 65)
- An aging population need care homes, special housing and day centres
- An aging population comes with a reduction in the workforce
- A shortage of workers could greatly negatively impact the country – the hope is that more young people will work
- Political priorities: pensions, healthcare and age descrimination
d. a study of the advantages and disadvantages of an ageing population within a country
CASE STUDY: The UK
Stats:
- 5.4 mil women
- 3.9 mil men
- 10% still working
- 70% dependent on state benefits
- 2/3 are widowed women, 1/3 are widowed men
Economic plus:
- Those who are fit and able can cause a boom in the leisure business- helps the LICs as a tourist destination
Economic minus:
- With fewer people in the workforce, they have to raise taxes to support pensioners
- Present state pension needs to be raised
Social plus:
- Retirement resorts allow old people to interact and are able to be geared up with things that specifically elderly people need
Social minus:
- Who looks after the elderly? Now put away into care homes with pro care, rather than their kid’s love and care
Categories
Geography Topic 4: Coastal Landscapes
1.1 Coastal processes and landforms
a. types of wave: constructive and deconstructive
Deconstructive Waves 
- High wave (>1m)
- High wave energy
- High wave frequency (10 waves/min)
- Erodes material
- Backswash > Swash
Constructive waves
- Low wave (>1m)
- Low wave energy
- Low frequency (<10 waves / min)
- Deposits material
- Swash > Backswash
b. the impact of weathering, erosion and mass movement on the coast: cliffs and wave cut platforms, headlands and bays, caves, arches, stacks and stumps
Erosional Processes
- Hydraulic action
- Abrasion
- Attrition
Weathering Processes
- Biological weathering
- Chemical weathering
- Physical weathering
Mass Movement
- Rock fall
- Slumping
- Soil creep
Wave cut platforms
Erosional landforms
Concordant geology
Discorncodrant geology
Wave refraction
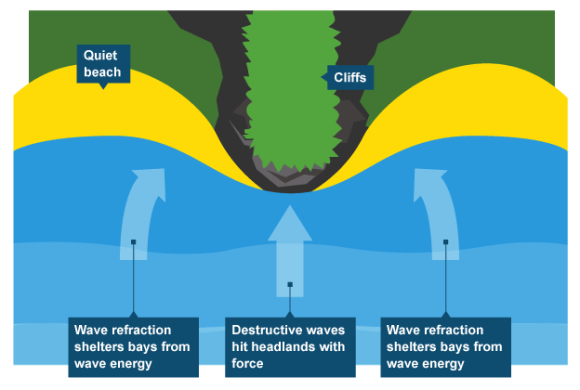
impacts on geology, people and vegetation
- Contamination of the water
- Increased flooding
- Change of typography of the land
- The amount of sand on the beach affects the waves of the beach
- Biological beings (plants, trees and animals) will be destroyed
- Plants roots prevent vegetation
- Houses, tourism and industrial sites are lost due to erosion on the coast
- Economy is damaged for repairs
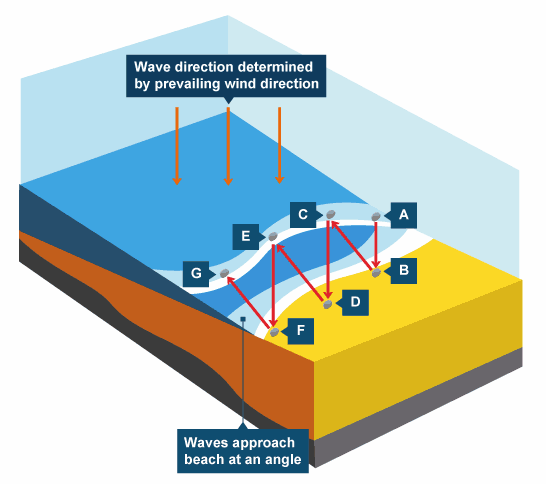
c. the process and impact of longshore drift on the coastline
d. the formation of beaches, spits and bars
- Beaches – formed by the deposition of sand, gravel, rocks and pebbles
- Spits – formed by longshore drift moving material across the coastline. Spits form where material is deposited. The spit may grow to form a hook, providing a sheltered area. Behind that is a salt marsh, which plays host to many rare plants and animals
- Bars – by the process of LSD, a spit will become a bar if the spit connects with the other headland. From there, it will form a lagoon.
1.2 coastal landforms are subject to change
a. differential rates of cliff recession due to factors such as fetch, geology and coastal management
Geology –
- Coastline with less resistant rock are eroded at a rate of 1-2m/year, as opposed to more resistant rock which typically erode at only a couple mm/year.
- Hard rocks form high, rugged and steep cliffs
- Soft rocks form slighter, less steep cliffs and often have evidence of slumping
Vegetation
- Vegetation prevents and protects against erosion
Sea level change
- Submergent coastline – they have rising sea levels with drowned valleys (vias) and drowned glacial valleys (fjords)
- Emergent coastline – falling sea levels with raised beaches and relict cliffs
Fetch
- The distance of sea over which winds blow and waves move towards the coastline
- Longer fetch = more destructive waves = more erosion – an example of this would be the south west coast of England ‘getting the fetch’ from the atlantic ocean
Coastal management
- If coastal defences protected weak geology, the rate of erosion would have been much slower
b. the effects of coastal recession on people and the environment
- Cliff recession has negative effects on both people and the environment
CASE STUDY: Durlston Bay, near Swanage – 1968-1988
- Cliff recession up to 12m a year, ending up 25m away from an apartment block
- Iconic park (Durlston Country Park) is home to 250 species of bird, their habitats are threatened by cliff recession which could affect the breeding of these rare species
- Property loss by cliff recession is not yet covered by UK insurance
- In the USA, about $80 mil is paid out for insurace due to coastal recession.
c. prediction and prevention of the effects of coastal flooding by forecasting, building design, planning and education
- Prediction – Suggesting what flooding is likely to happen in the future
- Prevention – Relates to the stopping of the impacts of flooding
Coastal flooding – Caused by strong winds and storms, increasing the height of waves and tide. The Environment Agency monitors the sea’s conditions 24/7, and the Storm Tide Forecasting service provides the Environment Agency with forecasts of flooding.
The Environment Agency has a 24 hour flood hotline and a website for precautionary advice, stating clearly the main threats to health during a flood (drowning, injuries), the stress of the event and cleaning up, serious danger caused by carbon monoxide fumes from the indoor use of generators and other fuel powered equipment
CASE STUDY: Thames Barrier (Thames Estuary 2010)
- Who: The Environment Agency
- What: Installing new flood walls along the river, plans to leave open space for flood plains
- Why: Insurance companies claim that flooding will be 8-12 times more frequent by 2010
CASE STUDY: Indonesian province of Atech
- 106 cases of tetanus, 20 deaths reported at the end of 2004, associated with the coastal flood after the tsunami.
- Why: mixing sea water with sewage in drains and poor healthcare
CASE STUDY: Bangladesh, Coastal embankment project
- What: This project led to the building of flood walls and 500 flood shelters to house 10,000 people. Local people are being taught on how to deal with a flood and flood warning systems are being put into place.
- Future: ensuring that the roof of 1-2 storey buildings have accessible exterior stairways so people can escape rising waters.
d. the types of hard and soft engineering used on the coastline of the UK and the advantages and disadvantages of these techniques
- Hold the line – Hard engineering
- Advance the line – taking the coastline artificially further
- Retreat the line – Allowing erosion to happen (doing nothing)
- Spectrum – Variety of measures to protect the coastline. You must use a spectrum of measures or the defence will not be effective
- Sacrificial coastline – Allowing the coastline to erode for economical reasons and protecting another for the same reason
| Soft Engineering Method | Description | Advantages | Disadvantages |
| Beach replenishment | Advancing the line by adding sand, rocks and pebbles – £5,000/m |
|
|
| Cliff regrading | Cliff cut back to be given a new, gentle slope to prevent slumping |
|
|
| Managed retreat | Doing nothing |
|
|
| Hard Engineering Method | Description | Advantage | Disadvantage |
| Rip rap/ Rock armour | Large rocks placed in front of a cliff – £300/m |
|
|
| Gabions | Wire cages filled with stones (£11 /m) |
|
|
| Recurved Sea walls | Seawalls protect the base of sand dunes (£3,000/m) |
|
|
| Groynes | Horizontal planks of wood that stretch from the coast to the sea (£5, 000 each) |
|
|
| Off shore reef | Large concrete/ natural boulders off shore that alter wave direction and energy (about £2,000 / m) |
|
|
1.3 coastal management
a. how the coast is managed in a named location
Case Study: The Holderness Coast
- Where: North of England (Flamborough Head –> 8o K of coastline –> Spurn head spit)
- When: 1991 –> onwards
- What: Cliffs retreat at an average of 1-2m/year, losing about 8m of land in a single storm
- Why: Strong prevailing winds create longshore drift, moving material from the North to South coast. Extremely powerful waves and poor geology (cliffs are made from boulder clay, eroded from hydraulic action, abrasion, corrasion and slumping)
Key area: Mappleton, 1991
- £2mil spent on rock groynes and rock armour at the base of a cliff
- Because of 50 high-end properties, large main road 30m from fast eroding coastline.
- Properties now increase in value as they are no longer subject to erosion
- Groynes stop LSD, but did increase erosion towards the south of Mappleton
Key area: Withernsea, 1975
- £6.3 mil on rock groynes, seawalls and riprap
- This is because Withernsea is of high economic value (particularly from tourists)
Key area: Bridlington, 2012
- £1.4 mil sea wall
- Residents feel much safer
Key area: North Yorkshire, 2001
- £3mil sea wall
- Stretch of coast exposed due to powerful waves, weak boulder clay
- Has a mass value housing development
Key area: Spurn head spit
- 2 groynes to stabilize the spit
- Hooked spot at the bottom of the Holderness coast with a triple SSI salt marsh (SSI – special scientific interest)
Categories
Geography: River Landscapes (Topic 3)
2.1 river processes and distinctive landforms
a. drainage basin terms: watershed, confluence, tributary, source and mouth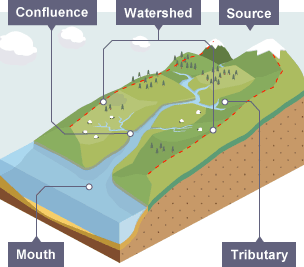
- Watershed – Boundary of a drainage basin – this separates one basin from another
- Confluence – point where two rivers meet
- Tributary – Small stream and where the river joins another river
- Source – Starting point of a river, often a spring or lake
- Mouth – Point where a river leaves its drainage basin, entering the sea.
b. The impact of weathering, erosion and mass movement on river landscapes
Weathering: The breakdown/decay of rocks by natural processes
Physical weathering – Freeze thaw / frost wedging
- This happens when rainwater enters the cracks/gaps in a rock – freezes when temperatures drop below 0 degrees c, the water expands, exerting enough pressure on the rock to break and shatter
Chemical weathering – Acid rain, salt crystal growth
- All rain is slightly acidic – air is polluted by factories and vehicles. When the rain falls on the rocks, acid reacts with weak minerals, causing them to dissolve rocks and decay
- Salt crystal growth – chemical reaction between the seawater and rock
Biological weathering
- Roots of plants, especially trees, grow into cracks in rock, splits it apart.
- Water gets through the cracks
- Animals past waste containing seeds
Erosion – wearing away/removal of material by chemical/physical means
- Hydraulic action – This results from the force of water hitting the riverbed and banks, wearing them away, especially during high velocity flow
- Abrasion – Caused by river picking up stones and rubbing them against the bed and banks of the channel in the flow – wearing the bed and banks away
- Attrition – Material carried along the river – eg. stones will become smaller and rounder as it travels downstream, colliding with other particles (like sand paper rounding of harsh edges)
- Corrosion – Dissolving of rocks and minerals by river water flowing over them
Mass movement – Downslope movement of material due to gravity
- Soil creep – Individual particles of soil move slowly down rope (either by moisture of gravity) and collects at valley sides, river erodes this material
- Slumping – Bottom of valley side is eroded by the river, makes the slope steeper – valley side material slides down in a rotational manner, often triggered by saturation by rain. This lubricates the rock, making it heavier.
c. changes in characteristics from source to mouth of a river and its valley
| Characteristic | Definition | Change from source to mouth |
| Width | Distance from one bank to another | Increases |
| Depth | Distance from the surface of the water to the river bed | Increases |
| Velocity | How fast the water is flowing | Increases |
| Discharge | The rate at which water is moved through the river channel | Increases |
| Gradient | Steepness of the land | Decreases |
Upper course features:
- Atmosphere – mushy, damp, windy and moist
- Terrain – often moor land, exposed and mountainous. Higher rainfall and snow-relief rainfall
- Fast flowing, high capacity for deposition, vertical erosion
- Interlocking spurs, v-shaped valleys, waterfalls
- Large rocks
Midcourse features:
- Atmosphere – Hospitable for humans, usually domesticated for farming
- Terrain – flat and manageable
- Meanders – deposition (shallow – inside bend) Erosion (steep – outer band, aka river cliff)
- Subject to flooding
- Oxbow lakes
Lower course features:
- Atmosphere – most hospitable
- Terrain – flat, if urbanised, covered by impermeable rock for industry)
- Dominant land use – farming (fertile land), primary housing, industry
d. formation of interlocking spurs, waterfalls, meanders, river cliffs, oxbow lakes, floodplains and levees
Interlocking spurs – upper course
- As water twists around obstacles, for example rocks and boulders because there is not enough velocity to cut through the obstacle, erosion undercuts outward bends in a zigzag formation
- From lower down, the interlocking of the spurs of land creates bends and locks the view of the valley.
Waterfalls – upper course / mid course
River cliffs – mid course
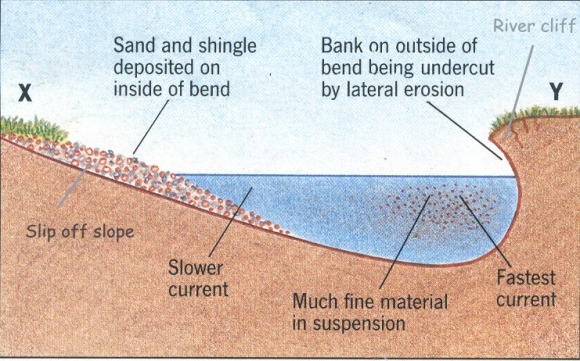
Meanders + oxbow lakes – mid course 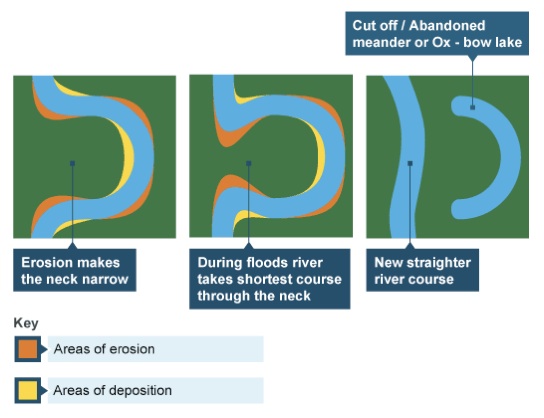
Flood plains – mid/lower course 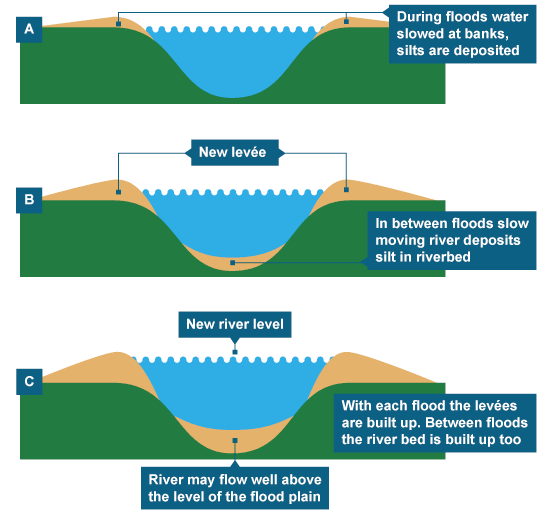
Levees – Mid/lower course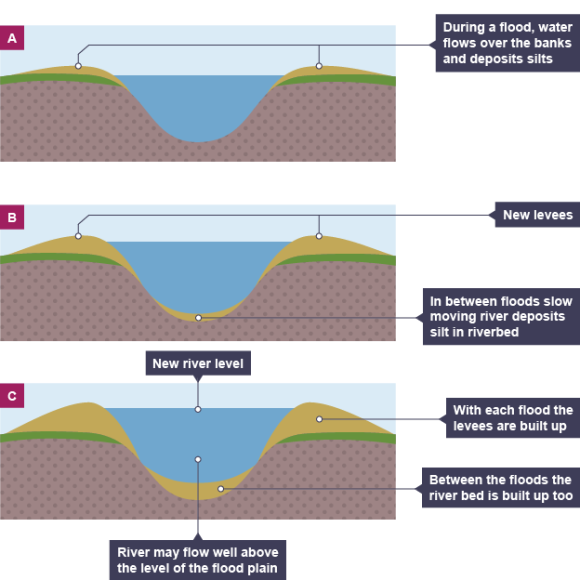
2.2 – flooding and flood prevention
a. the physical and human causes of river flooding
Physical causes of flooding
- Intense rainfall – when rainfall is too fast to fully allow its infiltration into the ground, it goes quickly into the channel as it flows across the surface
- Cloud bursts (Sudden, intense rainfall)
- Snowfall promotes rapid thawing – frozen rivers and ground, the temperature changes and the snow and ice defrosts. Water gets fed back into the ground and river with no infiltration time
- Hot weather ‘bakes’ (hardens) the ground, the ground is no longer permeable to water
- The laying of impermeable rocks like granite doesn’t let water infiltrate the ground – rainwater runs off surface into the channel very quickly
- Steep valley sides make the water run downhill, water hits the ground and consequently enters the rivers quicker.
Human causes of flooding
- Deforestation – trees (vegetation) slows down the time it takes for rainfall to reach the ground (lag time). Vegetation collects stores and uses water from the drainage basin. More lag time makes more water reach the channel, more flooding
- Urbanisation (building on a flood plain) – covering ground with hard, impermeable man made substances speeds up lag time
- Drainage systems within towns and cities alo water to flow back into the river channel quicker
- We don’t maintain drains enough, they’re ineffective at increasing lag time
- Climate change
b. the effects of river flooding on people and the environment
Effects on people
- Loss of belongings
- Damage to property
- Disruption to transport
- Disease and illness (trench foot, respiritory problems)
- Stagnant water breeds mosquito and chlorella cells
- Contamination of water supply
- Animal, crops, economic and human life loss
Effects on envirnonment
- Landslides
- Soil contamination by sewage
- Vegetation destroyed (herbs and medicinal plants)
- Drowning animals
- Soil erosion
CASE STUDY: Boscastle Floods, 2004
Causes of the flood:
- Small drainage basin – large volume of water collects quickly
- Steep valley sides – surface runoff travels quickly
- River Jordan passes 100m underground – ground already saturated with water, new influx of water cannot infiltrate
- Boscastle situated at the confluence of river Jordan and river Valency – less space to cope with large volume of water
- Buildings on a floodplain – water can’t infiltrate the floodplain
- Bridges over rivers – bottlenecks the river channel, increasing the risk of blockage
- Low drainage density -not enough rivers to drain the area
- Not enough channels – can’t take the water
Short term effects of the flood:
- Over 50 cars carried out to sea by 3m wall of water
- Clean up operation (village + community hall)
- Large damage to property
Long term effects of the flood:
- 2 months after the flood, still no public parking
- Tourist industry greatly affected (Main source of income)
Reduction of effects by future planning:
- Building on stilts – above ground level, less possessions damaged
- Electrical sockets to be moved up
- Making doors out of concrete rather than wood with chemical water proofing
- Using waterproof plaster in buildings
- Replacing heavy doors with removable, possibly buoyant ones
c. prediction and prevention of the effects of river flooding by forecasting, building design, planning and education
Forecasting
- River water levels are monitored by the Environment Agency
- If levels rise to a dangeorus point, they are to warn and evacuate
- Online maps show the areas of risk
- Computer stimilation models
Building Design
- Ceramic tiles and rugs instead of fitted carpets
- Raise the height of electrical sockets to about 1.5m above ground
- Fit stainless steel and plastic kitchens instead of chipboard
- Position essential parts of heating and ventilation upstairs
- Fit non-return valves on drains and water inlet pipes
- Replace wooden windows and door frames with synthetic ones
- In LICs, build houses onstilts
Planning
- Land zoning
Education
- Leaflets, advertisments in newspapers and tv
- Social media and websites
- Offering helpline services
- Drills and exercises
d. the types of hard and soft engineering used to control rivers in the uk and the advantages and disadvantages of these techniques
| Hard Engineering Technique | Description | Advantages | Disadvantages |
| Embankments (Levees) | Raised river banks |
|
|
| Channelisation | Deepening/widening/straightening of a river channel |
|
|
| Flood relief channels | Extra channels built next to/away from rivers, diverting floods away from settlements |
|
|
| Dams | Built along the course of a river to control the discharge. Water is held back and released later in a controlled way |
|
|
| Floodwalls | Vertical barrier usually made from fabricated concrete |
|
|
| Storage areas | Man made washland |
|
|
| Soft Engineering Technique | Description | Advantages | Disadvantages |
| Floodplain zoning | Authorities allocate areas of land to different uses according to level of risk |
|
|
| Washlands | Areas on the floodplain naturally allowed to flood |
|
|
| Flood warning systems | Rivers are carefully monitored – if alarm rises downstream residents will be notified |
|
|
| Afforestation | Planting trees in the catchment area to intercept rainfall |
|
|
2.3 – river management
a. how a river is managed in a named location
CASE STUDY: River Nene, Northampton
- River Nene frequently floods
- Heavy rain, April 1998 caused the river Nene and Grand Union Council to overflow, causing the death of 2 people
- 2002, the Environment Agency completed a £6.8 mil project to protect the hardest hit areas of Northampton, followed by 2003, 2007 where further works were carried out
Weedon, Northampton
- 2002, £2mil 450m clay flood embankment across the river valley (upstream of NH)
- Flood storage area behind embankment, regulated by a culvert
- Embankment landscaped for aquatic plants and animals
Upton Square
- Upperclass housing estate built above the level of the floodplain – making it safe to flood
Four Cotton, St. James
- 2003, flood warning systems upgraded
- 2 hours warning via text
- Within 2 hours, residents can move valuables and furniture and rugs upstairs, as well as pick a designated spot to go.
Billing
- Flood retention reservoir nearby the aquadrone
Foot Meadow
- 4m high walls installed to protect housing industry and inns
- Wash land created (an open area for the river to flood to, diverts the flow away from properties on the other side of the river)
- Debris cleared so river velocity can increase –> Rainwater taken away quicker
- Gabion baskets protect riverbanks
Upton, Sixfields
- 2007, £8mil spent developing a washland – effective diversion from the river Nene to reduce the risk of flooding downstream
- Major road – upton way – A45, built on embankments 6m high
- Upton Way embankment joins up to specially built floodgates to an area where 1.2 mil cubic meters of water can be stored
- River channel capacity increase – building earth embankments 10m from the river, aesthetically improved by planting trees
CASE STUDY: Blandford Forum
- River stour, Dorset, England
- 1979, May, 30 damaged properties. December, 110 damaged properties
Causes of the flood
- Floods from West –> east
- Upstream – town covered in impermeable clay
- Dense network of streams causes water level to rise quickly
- Deforestation increases lag time
- Narrow floodplain
- 5cm of intense rainfall over 24 hours
Schemes:
- Total cost: £1.45mil ,saving them from £1.6 mil worth of damage
- 2.5m flood wall
- 1m deep relief channel
- Southside flood bank protects a brewery, industry and housing
- Washland on the south allows water to flood with minimal impact
- Pumping station at Langton meadows directs water further downstream
Categories
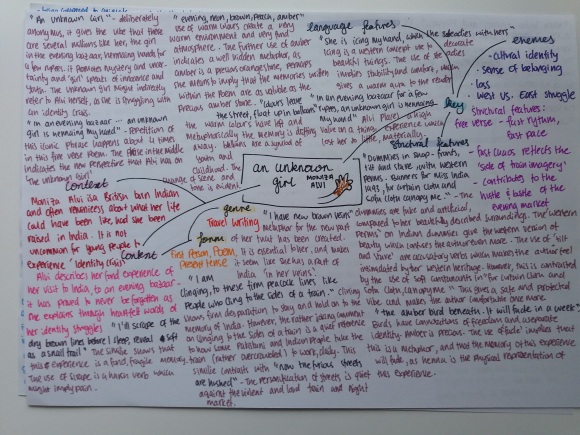
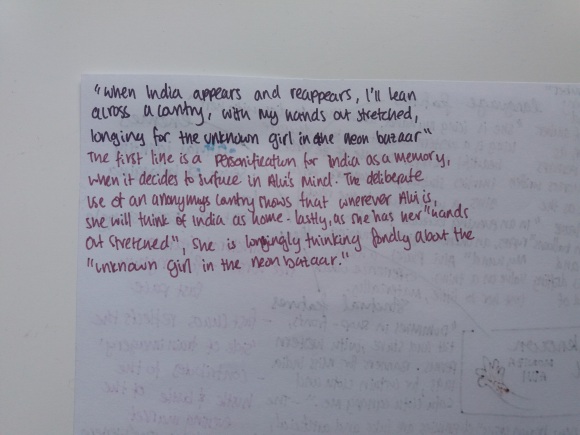
An Unknown Girl
Categories
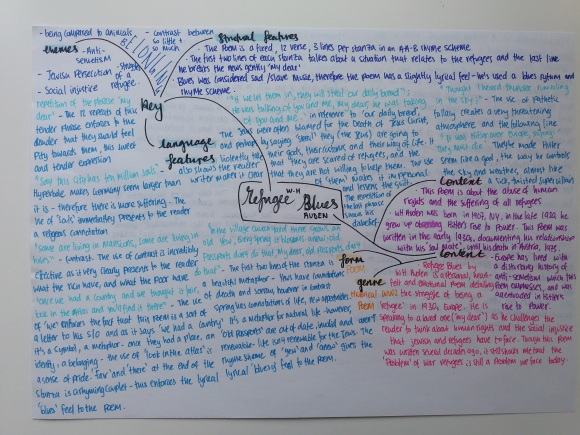
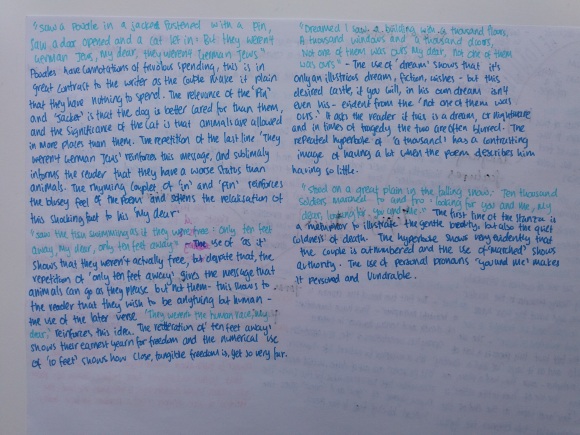
Refugee Blues
Categories
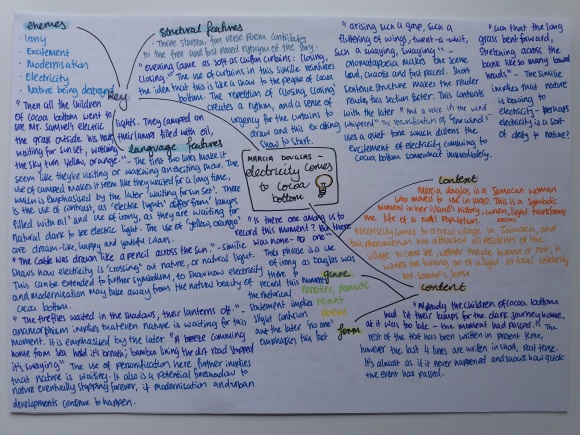
Electricity Comes to Cocoa Bottom